Background
The Toronto Real Estate market (and it’s surrounding areas – the GTA) have been red hot coming into 2017. According to the Toronto Real Estate Board (TREB), home prices on average have risen over 65% from 2012 to 2017 (TREB Historic Statistics). I decided to pull the TREB numbers into an excel sheet and see if there was anything we could learn from the data.
It seems the average sales price for homes in Toronto has not gone down in 20 years! That’s incredible. If you were to buy a home in 1996 for the average price of $198,150 and sold it in 2017 for the average price of $822,624, you gain a 315% return on investment! Of course hindsight is 20/20 and considering home prices took a dip in the 90s, you would be a little bit more hesitant on purchasing a home for investment purposes.
That being said, young Torontonians are currently facing a dilemma of being unable to afford purchasing a home due to the average 7% growth rate in sales prices since 1997. The median household income in Toronto was $78,373 in 2015 (StatsCan). Assuming a family making the median household income plans to get a mortgage, it is impossible for them to get a home for the average home price in 2017. At most they’ll be able to borrow $350,000 on top of their down payment towards paying for a home (CIBC Mortgage Affordability Calculator). Some critics have even classified the unprecedented growth in the GTA as a housing market bubble with an inevitable impending crash.
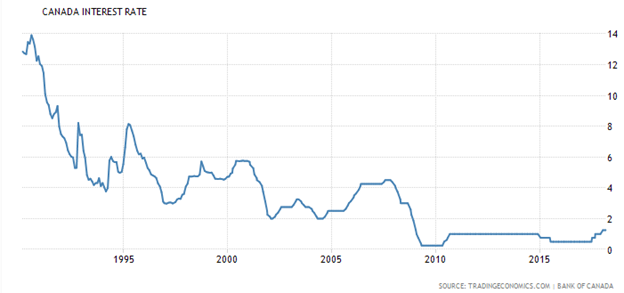
To combat these unprecedented increases and to help home ownership for Toronto residents become a reality, the Provincial and Federal governments have respectively introduced new laws. The provincial ruling focuses on creating a tax for foreign buyers that hold their money in speculation that their real estate investments will go up. The Federal government’s approach was to protect home owners’ ability to pay their mortgage payments if the interest rates go up. Currently in Canada, interest rates have been hovering near an all time low since the Global Financial Recession of 2008.
Non-Resident Speculation Tax (NRST) – effective April 21, 2017
More commonly known as The Foreign Buyers Tax, the NRST is a 15% tax on the purchase or acquisition of a residential property located in and around the Toronto region (especially the Greater Golden Horseshoe Region – GGH) by a foreign entity. The NRST was implemented in Ontario following a similar program to mitigate the rising prices of homes in British Columbia. The provincial government of Ontario stated that foreign entities accounted for 3.8% of transactions in Toronto during the season after the implementation of the tax. This might seem like a small percentage of the market, but removing those properties can impact the liquidity of the real estate market.
Residential Mortgage Underwriting Practices and Procedures – effective January 1, 2018
More commonly known as The Mortgage Stress Test, the Office of the Superintendent of Financial Institutions (OSFI) set a guideline that required uninsured mortgages to pass a “stress test” for the qualifying interest rate in a mortgage to be greater than the 5 year benchmark rate + 2%.
For example, the current 5 year benchmark rate is 5.14%, so in order to get an uninsured mortgage, one would have to be able to pay mortgage payments with an interest rate of 7.14% (5.14%+2%). Uninsured mortgages in Canada are generally mortgages that had a 20% or greater down-payment. Thus, the borrower would not be required to pay CMHC fees to become insured so there is no protection for the lender if the borrower defaults.
The Data
Now that we have the background as to what this analysis is trying to understand, I’ll introduce the holy grail so to speak of this project: the data. Bungol.ca has kindly provided sale level data from January 2016 to the end of March 2018. I have collated this data set with my previous dataset to get the last 11 quarters worth of data spanning nearly 3 years. With real estate data, the more recent, the better so we elected that getting more historical data would not provide anymore insight for the analysis. The objective of this analysis is to look at the market using the most granular data available to provide a second opinion to the narrative that is pushed from TREB. It is also an example as to what can be done with access to the data. This is done for research purposes only.
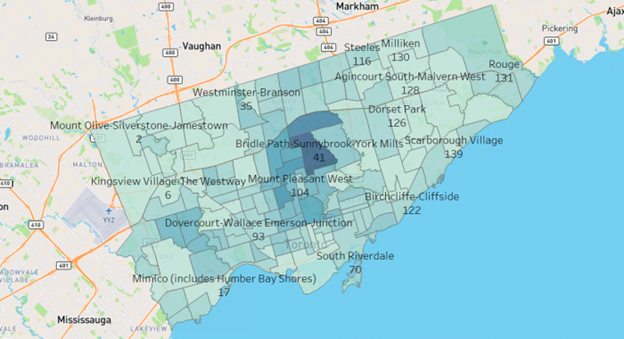
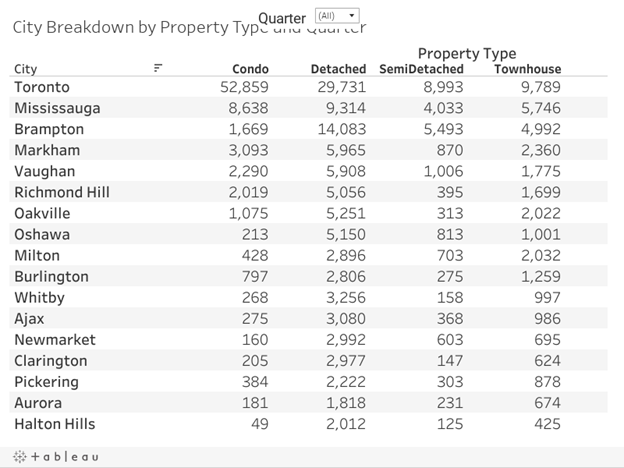
The following is a breakdown of number of sales by geographic location and property type for the past 11 quarters.
Breakdown of Properties Sold by City and Quarter
Analysis
Was there a housing bubble in Toronto? Is it still here? And did the governmental intervention help ease the market?
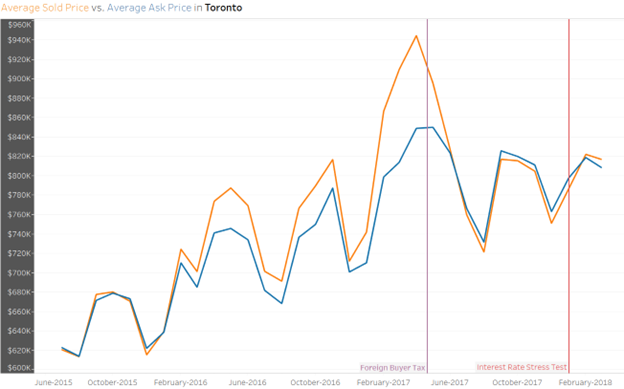
Unfortunately it isn’t as easy to tell if there’s a bubble since correlation does not imply causation. However, throughout the GTA (irregardless of neighbourhood) from Q3 2016 to Q2 2017 there is a giant gap between the sold price and the original list price. As many can remember, this environment was created by an onslaught of bidding wars. An economic bubble (Investopedia) is classified as a period of rapid escalation in prices followed by a contraction. The gap between 2016-2017 does identify a rapid price escalation compared to other similar periods, but there isn’t much of a contraction thereafter. The overall average sold price hasn’t dropped by much since the gap period besides your regular seasonal effects.

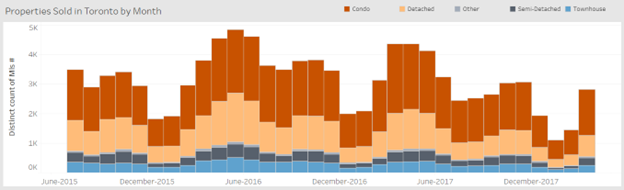
The overall number of homes being sold on the other hand has significantly decreased with March 2018 (2,817) having a 35% drop of homes sold in Toronto compared to March 2017 (4,362). Arguably, one should not look at 2017 as a benchmark since it was the peak, but in March 2016 (3,795) there were still approximately 1000 more homes sold than March 2018. This is expected as investors are awaiting appreciation of their asset before selling it off. The decrease in properties sold may eventually lead into more liquidity into the markets and lower prices, but as of now it seems we’re at a stand still.
Have housing prices hit a threshold? Most believe that these interventions are small obstacles that will only slow down the market for a short period of time. After all, everyone needs a place to live, right? Well yes, but they should only own a place if they can afford it. Renting is always another option for the basic necessity of shelter. Unfortunately, the recent rent costs in and around Toronto have risen significantly due to a mixture of government policy and a shift of more consumers into that market. Housing is and will continue to be a major issue in the Greater Toronto Area, with no signs of cooling down any time soon. As municipal and provincial elections gear up around the region, voters should be mindful of how our politicians intend to tackle this endeavor.
What can this data tell us?
To better understand the data, I’ve merged together some StatsCan data with the neighbourhood sale data to create shareable reports to allow the general public to be more aware of trends that’s happening in their area. Don’t know what your neighbourhood is? The city of Toronto has an location lookup for that. If you don’t live in Toronto, check out the City Reports that cover the GTA region for home sales.
Dashboard
To run your own in depth analysis of the data, check out the dashboard that Nick Mourtos compiled below:
Analysis and Report by Shafquat Arefeen
Dashboard created by Nicholas Mourtos
Data provided by Bungol.ca